Fourteen percent. That was the allowed return on equity for American investor-owned electric utilities in the early 1980s — the rate that state public utility commissions determined was sufficient to attract capital while keeping consumer prices reasonable. Today the number is roughly 10%. Four percentage points of compression across four decades. In absolute terms, the change looks modest. In structural terms, it is the single most important number in infrastructure economics — because it describes the treadmill that every regulated monopoly eventually rides, and because the man who designed the treadmill did it on purpose.
The Chaos
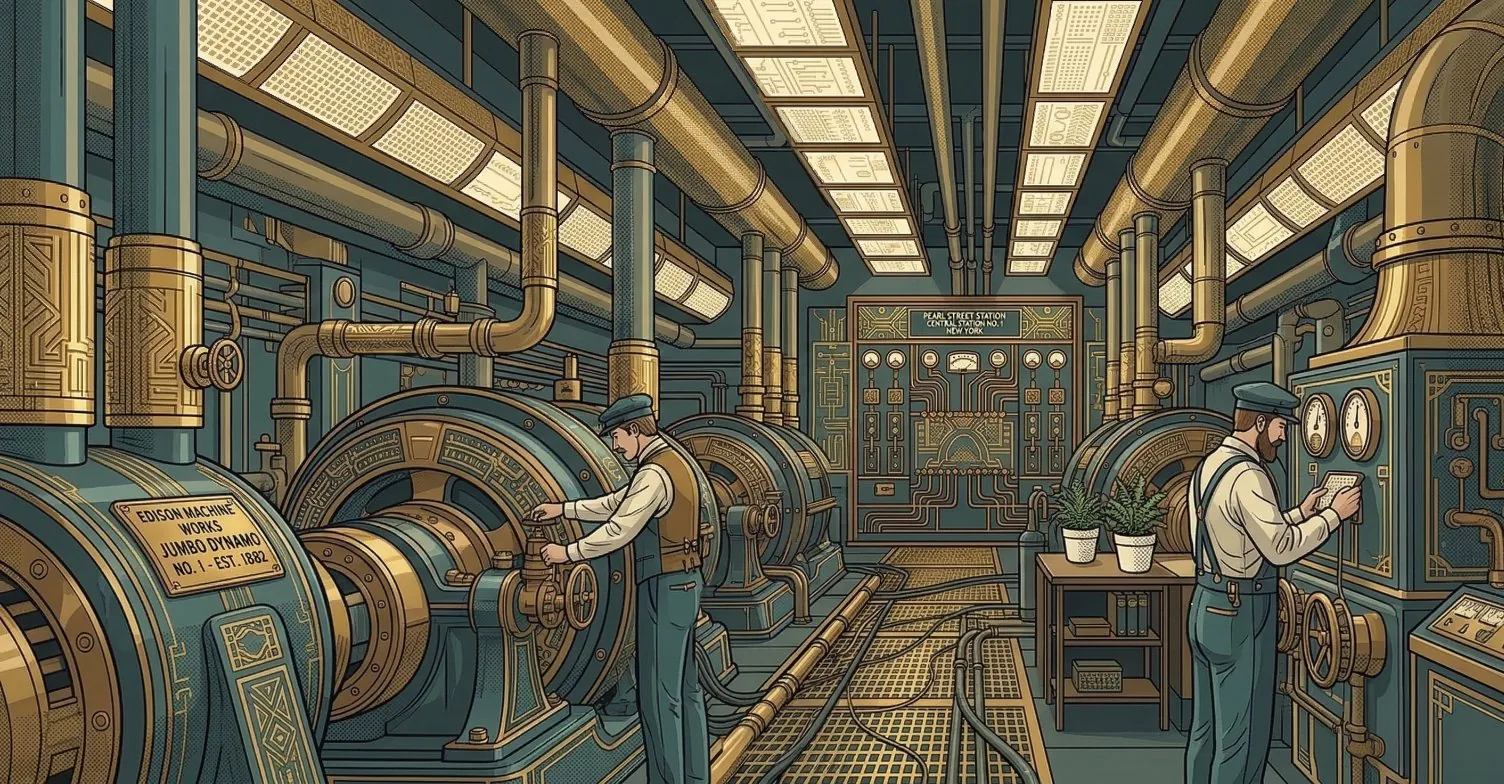
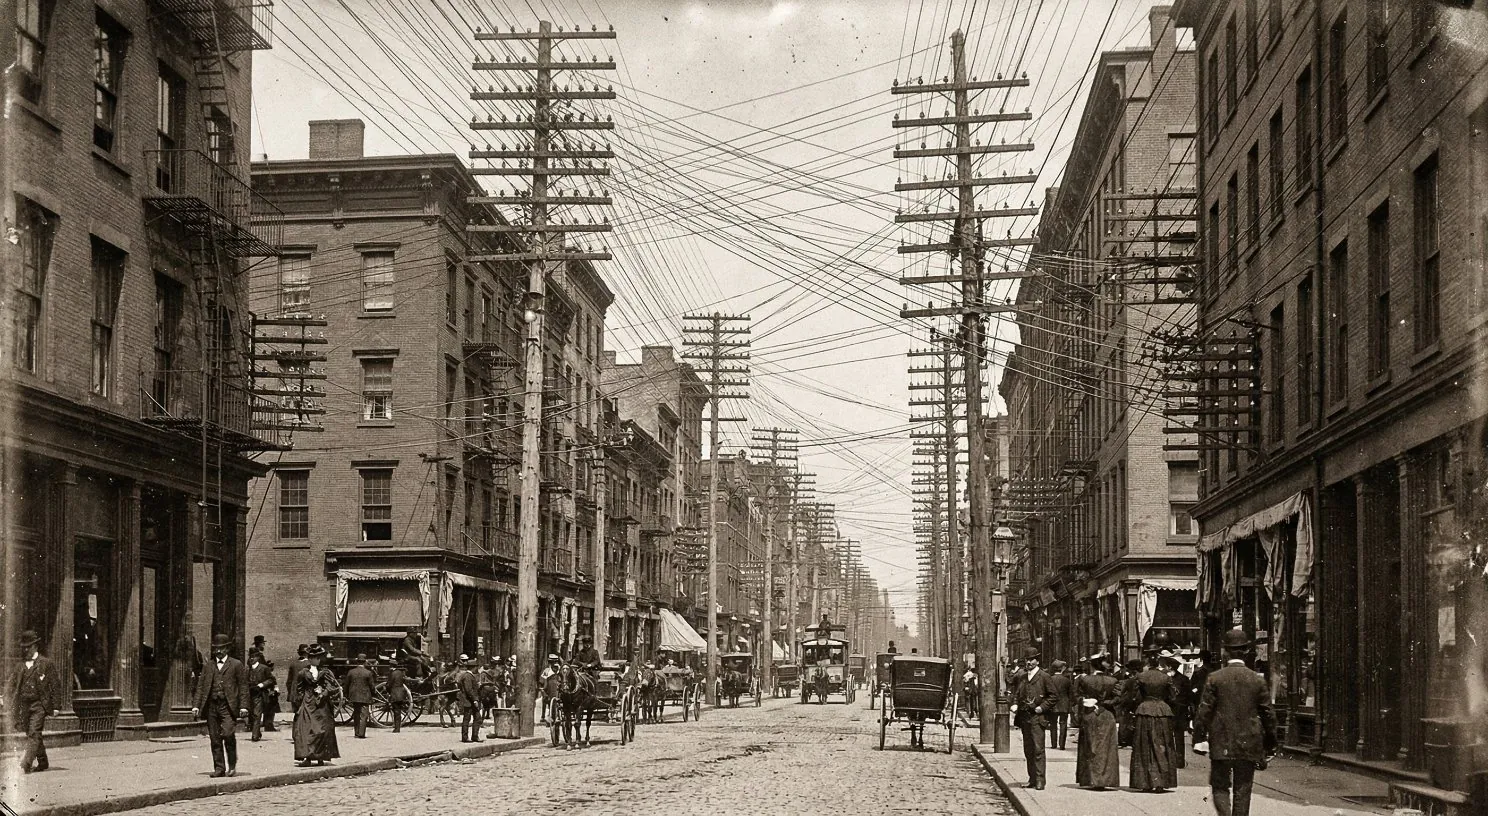
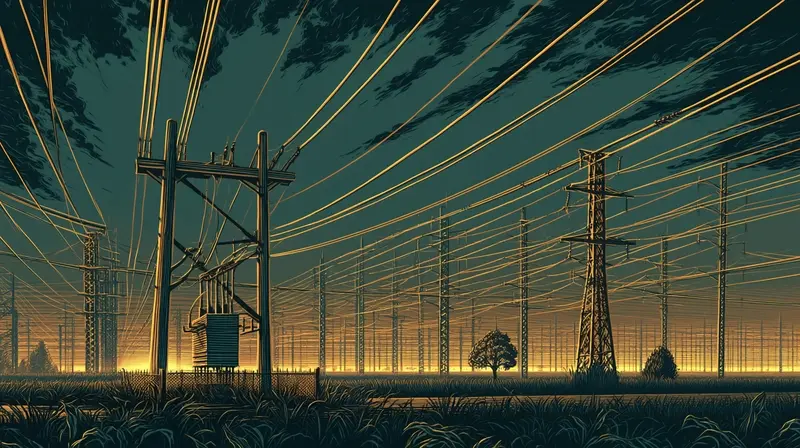
Thomas Edison's Pearl Street Station lit lower Manhattan in 1882. Within a decade, dozens of competing electric companies had strung overlapping wires through American cities. Gas companies fought price wars in Baltimore. Competing sets of overhead wires collapsed under ice storms. Firms failed regularly. Consumers faced wildly inconsistent service and wildly inconsistent prices.
The economic structure of the industry made this inevitable. Electrical infrastructure requires enormous fixed capital — generation plants, transmission lines, distribution networks — and delivers very low marginal cost per additional customer once the infrastructure exists. A power company that serves a hundred thousand homes spreads the cost of its generators across all of them. A competitor that builds a second set of generators and wires to serve the same hundred thousand homes doubles the infrastructure cost without reducing the per-unit cost of electricity. Both companies operate at sub-optimal scale. The math is unambiguous: one firm serving all customers achieves lower average costs than two firms splitting the market.
Economists would later call this the natural monopoly condition — a market in which a single firm can produce at lower cost than any combination of multiple firms. In the 1880s, nobody had the term. They had the wires collapsing in ice storms.
The Bargain
The pivotal figure was not an economist but a businessman. Samuel Insull — British-born, Edison's protégé, builder of Chicago Edison — understood the natural monopoly condition before anyone had named it, and he understood something else: an unregulated monopoly would eventually be taken away. Cities across America were threatening to municipalize their electric utilities. If Insull didn't offer the public something, the public would take everything.
In 1898, Insull proposed the deal that defined American infrastructure for the next 140 years. Utilities would accept government oversight of their rates. In exchange, they would receive exclusive territorial franchises — the legally guaranteed right to be the sole provider in a given area. This was not altruism. It was capital engineering.
Franchise protection eliminated the risk that a competitor would enter the market and undercut prices. Eliminate that risk, and investors demanded lower risk premiums. Lower risk premiums meant cheaper capital. Cheaper capital meant Insull could finance expansion at lower rates, attract more customers, spread his fixed costs further, and lower prices — a virtuous cycle he called the "gospel of consumption." By 1910, he had crystallized the philosophy in a single sentence: "The obligations of monopoly must be accepted."
The regulatory model that emerged was rate-of-return regulation. The formula is elegant enough to fit on an index card:
Utilities could charge rates sufficient to recover their costs plus a regulated percentage return on their physical capital. The larger the rate base — the more infrastructure in the ground — the larger the absolute dollar profit, even though the percentage return was capped. This created a specific incentive structure that would take economists 60 years to name and that persists to this day.
The Perverse Incentive
In 1962, Harvey Averch and Leland Johnson published a paper identifying what the rate-of-return formula actually incentivizes. Since profit is a fixed percentage of the rate base, utilities have a structural incentive to over-invest in capital assets — even when operational alternatives (demand response, efficiency programs) would be cheaper. More capital in the ground means a larger rate base. A larger rate base means more dollars of profit. The percentage is capped. The base is not.
Simultaneously, every efficiency gain a utility achieves is eventually captured by regulators in the form of lower allowed rates. A utility that invests in automation to reduce operating costs by $50 million will, at the next rate case, see that $50 million passed to consumers as lower prices. The utility cannot permanently retain the fruits of its own improvement. The result is a sector structurally oriented toward capital accumulation rather than operational efficiency — earning modest but highly predictable returns, with almost zero possibility of outsize profit.
The treadmill: returns compress over decades as regulators benchmark against peer utilities and falling Treasury rates. But they compress gradually. Capital still flows in because the returns, while modest, are guaranteed. No other business model in the American economy offers this combination of certainty and scale. It is boring by design.
| Decade | Avg. Allowed ROE | Primary Rate Base Driver | Cost Trend |
|---|---|---|---|
| 1960s | ~12% | Large thermal plants | Declining |
| 1970s | ~13% | Nuclear construction | Rising sharply |
| 1980s | ~14% | Stranded nuclear, pollution controls | Rising |
| 1990s | ~12% | Deregulation experiments | Flat |
| 2000s | ~11% | Grid reliability, early renewables | Rising |
| 2010s | ~10.5% | Grid modernization, solar/wind | Mixed |
| 2020s | ~10% | Electrification, AI data centers, storage | Rising |
Read the two columns together. The allowed return compresses while the rate base expands. Utilities earn a smaller percentage on a larger number. The formula demands growth. The treadmill doesn't stop.
The Rise and Fall
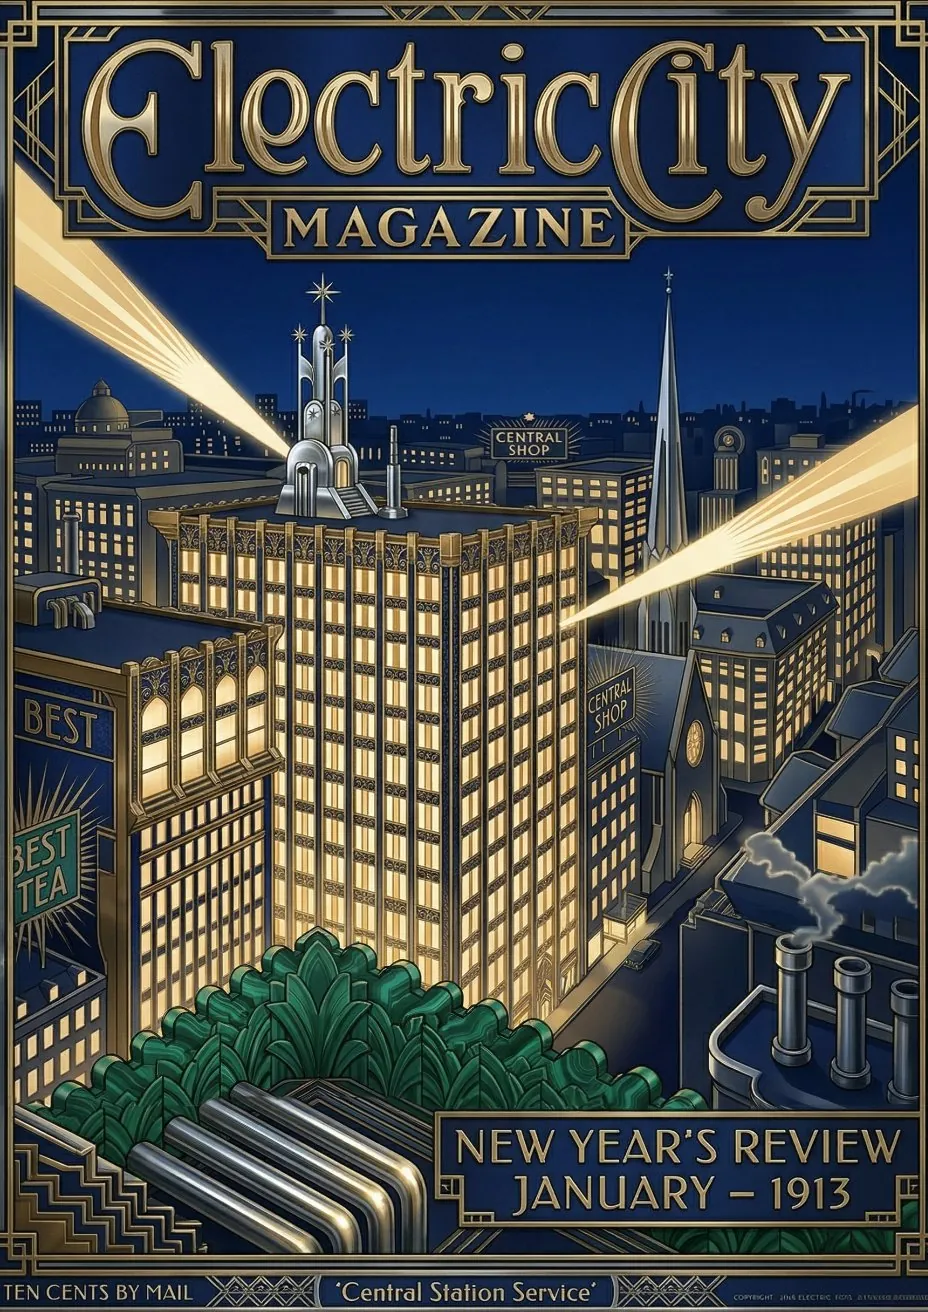
Before the treadmill, there was a golden age. From the late 1930s through the early 1970s, electrical technology was advancing rapidly — turbines grew from tens of megawatts to hundreds, heat rates fell with each generation of equipment, average generation costs declined every year. Under rate-of-return regulation, this created a rare political alignment: utilities earned their allowed ROE on growing rate bases while simultaneously passing lower costs to consumers. Real residential electricity prices fell for decades. Regulators approved expansion. Capital flowed in. Everyone was satisfied.
By mid-century, the institutional structure had crystallized completely. Investor-owned utilities served roughly 72% of American customers in exclusive franchise territories. By 1923, there had been over 3,000 municipal utilities, but technological improvements made smaller plants uneconomical — most cities sold their assets to IOUs as the scale advantages became overwhelming.
The golden age ended with the 1973 oil embargo. Fuel prices spiked beyond anything utility planners had modeled. Environmental regulations added costs. And crucially, economies of scale in generation technology reversed — the engineering limitations of ultra-large turbines meant the newest plants were not significantly cheaper per kilowatt than the previous generation. The secular decline in generation costs, which had sustained the political compact for 30 years, stopped.
Utilities found themselves trapped. Costs were rising. Regulators refused commensurate rate increases. Many had committed to enormous nuclear plants — the Averch-Johnson incentive at its most destructive, since nuclear was the most capital-intensive option and therefore the largest rate-base addition. Construction costs exploded from roughly $400 per kilowatt in the early 1970s to over $3,000 by the mid-1980s. The Washington Public Power Supply System defaulted on $2.25 billion in bonds in 1983 — the largest municipal bond default in American history — after abandoning two of five planned plants. Ratepayers paid for decades for electricity that was never generated.
Some regulators disallowed portions of completed plant costs from the rate base — effectively expropriating shareholders who had invested in good faith under the old compact. The concept of stranded costs entered the vocabulary: capital investments that could no longer earn their allowed return.
-
1882Edison's Pearl Street Station. Competitive chaos begins.
-
1898Insull proposes the bargain: rate oversight for franchise protection.
-
1907Wisconsin creates the first state public utility commission.
-
1935PUHCA breaks up pyramided holding companies. TVA sells power at 2.75¢/kWh as a public yardstick.
-
1940s-1970sGolden age. Falling generation costs. Rising rate bases. Political alignment.
-
1973Oil embargo. Costs reverse. The golden age ends.
-
1992Energy Policy Act requires open transmission access. Partial deregulation begins.
-
2000-2001California electricity crisis. Deregulation's worst-case scenario.
The deregulation experiment of the 1990s — the theory that competition could discipline costs better than regulation — produced a mixed record, culminating in the California crisis. Enron and other traders manipulated newly deregulated wholesale markets, producing rolling blackouts and billions in excess costs. The episode clarified something the golden age had obscured: the natural monopoly condition persists in transmission and distribution even if generation can be competitive. You can't duplicate a transmission grid. The regulatory solution was vertical unbundling — competitive generation, regulated monopoly wires. This structure now dominates in most states.
The Treadmill Today
A utility earning 10% ROE on a $10 billion rate base earns $1 billion. If it invests $2 billion in new infrastructure and earns 10% on the enlarged $12 billion base, it earns $1.2 billion — 20% more dollars, but no improvement in the margin rate. Meanwhile, the cost of that $2 billion investment is passed to ratepayers. Electricity prices are up 28% since 2020, with a 4.8% increase in 2025 alone.
The treadmill is now accelerating from both directions. From the demand side: AI data centers could add 176 gigawatts of new electricity demand by 2035, requiring massive grid investment that ratepayers must fund. From the supply side: distributed solar and battery storage are making it economically rational for large customers to partially defect from the grid — generating their own power rather than buying it from the utility.
This produces the scenario that utility economists call the death spiral. Rising rates push customers toward self-generation. Self-generation reduces the customer base over which fixed costs are spread. A smaller customer base means higher per-unit costs. Higher costs push more customers to self-generate. The spiral feeds itself. It is the same structural dynamic that ultimately destroyed the monopoly premise for long-distance telephone service and for freight rail — the moment when the natural monopoly's own pricing makes alternatives viable.
The bargain was never about the percentage. It was about the guarantee. And a guarantee that produces a death spiral is still, technically, being honored.
Fourteen Percent
Fourteen percent was the return in 1980. Ten percent is the return today. The compression took four decades and it followed exactly the trajectory that Insull's 1898 framework implied — not because anyone planned the compression, but because the structure guarantees it. Regulators benchmark against peer utilities and Treasury rates. Both decline over time. The allowed return follows.
What Insull could not have anticipated is that the bargain would survive the conditions that made it rational. The golden age is 50 years gone. The cost advantages of scale have reversed. The treadmill is accelerating. And the formula is still the formula — operating costs plus a regulated return on the rate base. The same index card. The same math.
The incentive Averch and Johnson identified in 1962 isn't a bug in the formula. It's the business model. It was always the business model. Fourteen percent to ten percent is four decades of regulators discovering that a guaranteed monopoly needs less compensation than they thought — and four decades of utilities discovering that the only way to grow earnings on a shrinking percentage is to grow the base it's applied to. The number on the card keeps getting smaller. The card itself hasn't changed.
Part of the Infrastructure Economics series